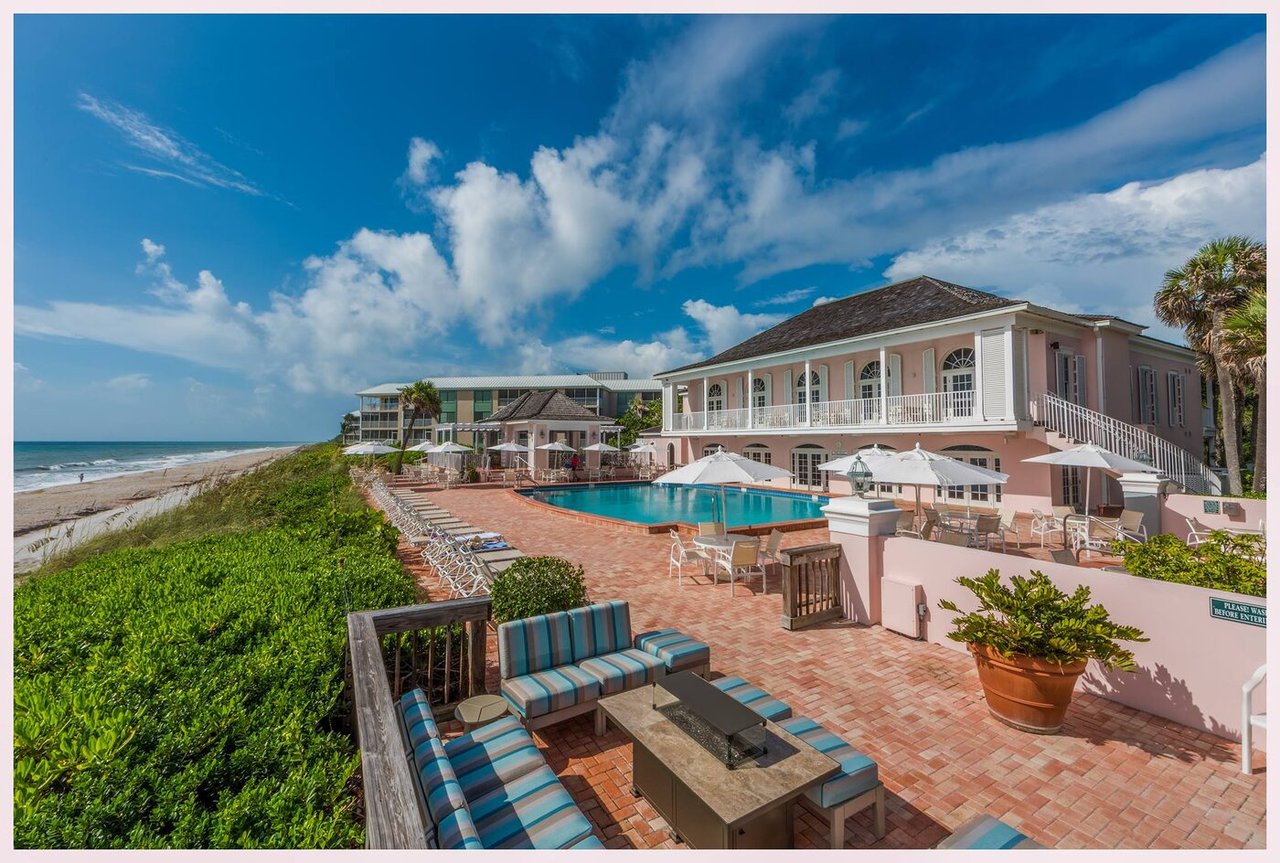
Every list price is an argument, and by July the strongest evidence available on Vero Beach's 32963 barrier island is six months old. Closed sales through June 30 — 348 of them, up from 269 over the same span in 2025 — are the most complete record of what this market has actually paid, not what it might pay next. They say two things at once: the island absorbed considerably more volume than it did a year ago, and it did so at a median price that moved less than one percent. A seller who hears only the first half of that sentence will price too high for what the data supports.
That distinction matters more in July than in most months, because much of what circulates about the barrier island this time of year is directional — an active listing here, an asking price there. Closed data is different: it is the transaction, not the ask. Across MLS areas 11 through 14, the median closed price for the first half of 2026 was $982,500, against $990,000 over the same months in 2025 — a decline of eight-tenths of one percent. Total dollar volume, meanwhile, rose from $399.2 million to $535.9 million. A seller who reads only the volume figure will conclude the market has grown more generous. It has not. It has grown busier.
The Number Sellers Keep Misreading
Why more volume did not mean more price
Rising sales and a flat median can look, at a glance, like contradictory signals. They are not. When transaction count and dollar volume climb together while the median holds still, the market is absorbing more inventory at prices it has already established, rather than bidding those prices upward. For a barrier island whose value rests on scarcity, that is closer to discipline than to weakness — and it carries a direct implication for pricing. The fact that 79 more homes changed hands this year is not, by itself, evidence that a given property is worth more than the same home would have fetched last summer.
The Median Stayed Home; the Ceiling Did Not
One nuance is worth isolating. While the median barely moved, the average closed price rose 3.8 percent, to $1,539,801, and the single highest sale on the island roughly doubled — from $9 million in the first half of 2025 to $17.75 million in 2026. That combination points to where this year's real appreciation actually lives: at the very top of the market, where a handful of larger transactions pulled the average upward, rather than across the broad middle where most sellers compete. A property priced against the island's new ceiling, rather than against its own comparable set, is pricing against an outlier.
Single-Family and Condominiums Are Not Pricing on the Same Curve
Two segments, two different arguments this July
The zip-wide median obscures a split that matters more than the headline number. The single-family median rose 11.5 percent year over year, from $1,345,000 to $1,500,000 — a genuine, broad-based gain. The condominium median, by contrast, moved only 1.5 percent, from $650,000 to $660,000, even as condominium transactions jumped 40.6 percent, from 106 to 149 closings.
For a single-family seller, the first half of 2026 supports a firmer number than a year ago; the market has demonstrated, in closed transactions rather than opinion, that it will pay more for comparable product. For a condominium seller, the lesson runs the other way. More buyers showed up this year — the volume increase is real and substantial — but they did not pay a premium for the privilege. A unit priced meaningfully above the established range is not pricing to this year's demand. It is pricing to its own optimism.
Where the Buyer Pool Actually Is
Closed sales by price band, first half 2025 vs. 2026
Pricing a home is, in practice, a decision about which buyer pool to compete in. The closed-sale distribution across six price bands makes the size of each pool explicit.
Two out of every three closings on the barrier island this year — 67 percent — settled between $500,000 and $2 million. That band is not merely a segment of the market; for practical purposes, it is the market. Above $2 million, the pool narrows to one closing in five. Above $3 million, it narrows again, to roughly one in nine. None of that means a property above $3 million cannot sell — forty of them did, up from 27 a year earlier, and the ceiling rose to $17.75 million. It means a seller pricing into that tier is competing for a materially smaller, more deliberate slice of the market's activity, and should set expectations for pace and process accordingly.
Area by Area: Why One Comp Isn't Enough
Median price by MLS area, first half 2025 vs. 2026
A single zip-code figure flattens an island that does not behave like one market. Every MLS area posted a double-digit gain in closings; not every area moved on price.
MLS area | Sales '25→'26 | Median '25 | Median '26 | Δ Median |
|---|---|---|---|---|
Area 11 — Central Beach, Riomar, Riverfront | 65 → 88 | $865,000 | $964,000 | +11.4% |
Area 12 — Moorings, Sea Colony, Southwinds | 62 → 83 | $1,175,000 | $1,150,000 | −2.1% |
Area 13 — John's Island, Sea Oaks, Orchid Island | 125 → 159 | $950,000 | $927,000 | −2.4% |
Area 14 — North island: Orchid, Windsor | 17 → 18 | $1,350,000 | $2,492,500 | n/m |
Area 11 — Central Beach, Riomar and the Riverfront corridor — is the one part of the island where the data supports asking for more than a year ago: its median rose 11.4 percent, to $964,000, on a jump from 65 to 88 closings. Area 12, covering the Moorings, Sea Colony and Southwinds, added 21 sales while its median drifted down 2.1 percent, to $1,150,000 — a move small enough, against that much added volume, to read as essentially flat rather than declining. Area 13 — John's Island, Sea Oaks and the Orchid Island clubs — tells a similar story at greater scale: 34 additional closings, a 27 percent jump in volume, against a median that moved from $950,000 to $927,000, a two-and-a-half-point shift within the range of normal noise for a market absorbing this much new activity. Area 14, the far-north enclave of Orchid and Windsor, is shown for completeness; at 17 and 18 sales in the respective periods, its median is driven by the mix of a handful of estates rather than any underlying trend.
The practical read for a seller in Sea Oaks, John's Island or the Orchid corridor: this year rewarded precision, not escalation. More buyers arrived and more homes closed, at prices that tracked almost exactly where they stood a year ago.
This reflects closed-sale price data only, drawn from complete Realtors Association of Indian River County MLS records for January 1 through June 30 of 2025 and 2026, across barrier-island MLS areas 11–14. It does not include days-on-market or original list price, so it speaks to what the market has paid, not how quickly it has paid it — that reads best alongside a property-specific conversation with a local agent. Area 14 medians are shown for completeness but are not statistically meaningful given fewer than twenty sales in either period.
What a July List Price Should Rest On
Translating six months of closed data into a number
Three things follow from the first half of 2026, and each argues for the same discipline. First, anchor to the specific MLS area and property type, not the zip-wide headline — Area 11's 11.4 percent gain and Area 13's essentially flat median describe two different markets sharing one zip code. Second, know which buyer pool a price point competes in: two-thirds of this year's closings sit between $500,000 and $2 million, and a price set above that band should be set with the smaller pool, and likely longer process, in mind. Third, treat the segment split as real — single-family sellers are pricing into demonstrated strength; condominium sellers are pricing into demonstrated volume, which is a different thing entirely.
What the data cannot do is measure how quickly a correctly priced home moves once it is listed, or how a specific property's view, dock, or renovation sets it apart from its area's median. That is where six months of closed transactions end and a property-specific conversation begins.
Frequently Asked Questions
32963 barrier island pricing, mid-year 2026
What should I list my Vero Beach barrier island home for in July 2026?
The first-half 2026 data argues for anchoring to your specific MLS area and property type rather than the zip-wide median. Single-family sellers have evidence of an 11.5 percent median gain to work with; condominium sellers have evidence of a 40.6 percent jump in buyer volume but almost no gain in price. A price above $2 million competes for about one in five of this year's closings, and above $3 million, about one in nine.
Is the Vero Beach 32963 real estate market getting more expensive in 2026?
Barely, at the median. The zip-wide median closed price moved from $990,000 in the first half of 2025 to $982,500 in the first half of 2026, a change of less than one percent. The average price and the ceiling both rose — the top sale went from $9 million to $17.75 million — indicating the year's real gains concentrated at the very top of the market rather than across the typical transaction.
Are single-family homes or condominiums appreciating faster on the barrier island?
Single-family homes. The single-family median rose 11.5 percent year over year, from $1,345,000 to $1,500,000. The condominium median rose only 1.5 percent, to $660,000, even though condominium sales volume grew 40.6 percent.
How much of the Vero Beach barrier island market sells above $2 million?
About one in five closings. In the first half of 2026, 70 of 348 closed sales — roughly 20 percent — priced above $2 million. Sales above $3 million made up about 11.5 percent of closings, or roughly one in nine.
Which Vero Beach barrier island community had the strongest price growth in 2026?
Area 11 — Central Beach, Riomar and the Riverfront corridor — posted the clearest gain, with its median rising 11.4 percent to $964,000. By contrast, Area 13, which includes John's Island, Sea Oaks and the Orchid Island clubs, saw closings jump 27 percent while its median held essentially flat, moving from $950,000 to $927,000.
What data was this pricing analysis based on?
Complete closed-sale records from the Realtors Association of Indian River County MLS for January 1 through June 30 of 2025 and 2026, covering barrier-island MLS areas 11 through 14. The analysis reflects closed sale price only; it does not include days-on-market or original list price.